


Build insights at scale with the new CARTO Spatial Features data


In late 2020, we released CARTO Spatial Features for the first time. This unique data product provides derived variables across a wide range of themes including demographics, points of interest, and climatology data with global coverage. Spatial Features has been designed to increase the efficiency of data science and analytics teams, helping them reduce the time spent in curating spatial data to include as input to spatial models.
Today we are pleased to announce the release of a new version of Spatial Features! The new version comes with all of the usual fields, but now also includes new variables that model human activity, night light intensity and the presence of telecommunications infrastructure. This new version of the product also comes in the same geographic support systems as earlier versions, which are based on Spatial Indexes; namely H3 and Quadbin grids. Spatial indexes are global grid systems that tessellate the world into regular, evenly-shaped grid cells to encode location, and are designed for extremely fast and performant analysis of big data. You can learn more about them in our free ebook Spatial Indexes 101.
Let’s explore the new variables available!
In this new version of Spatial Features, you will find a new column named ‘human_activity_index’. This index, modeled by CARTO, assigns a score ranging from 0 to 100 to represent the level of human activity in a given grid cell. A score of 0 indicates areas with very low or no human activity, while a score of 100 means highly busy areas. This index is calculated at the country level, enabling comparisons within a country. Therefore, caution is advised when comparing different countries, even those with similar characteristics.
To build this index, CARTO’s Data Science team has combined different sources of data that have proved to be related with human presence into a single, meaningful composite score:
- The total population, that provides a quantitative measure of the number of individuals inhabiting a particular area.
- The total number of POIs, which offers valuable insights into the infrastructure and livability of an area. These include all POI categories available in Spatial Features: retail, the restaurant industry, education, transportation, financial businesses, healthcare, leisure, and tourism attractions.
- The number of telecom cell towers, that indicates where people live, work, or frequent as they rely on these services for connectivity.
- The nighttime lights, that serve as a powerful indicator for infrastructure presence and energy consumption, showing residential and commuting zones.
All these separate variables are readily available in this new Spatial Features version, allowing users to use and combine them in different ways if needed.
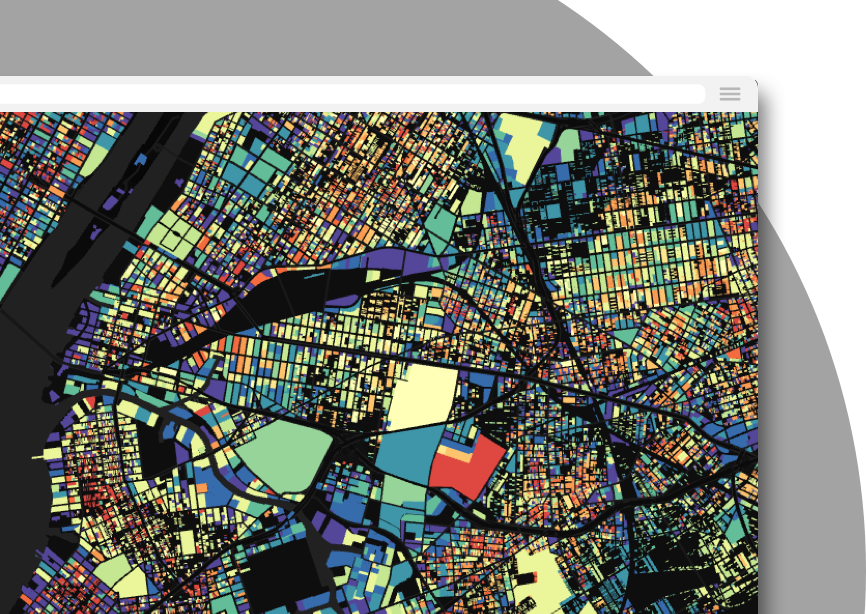
Human Activity Index in the USA; open in full screen here.
Spatial Features now contains a new variable called night-time lights. This is based on data provided by the Earth Observation Group, and offers annual averaged-masked (i.e. cloud-free) night-time light intensity data measured in nW/cm2/sr. This feature helps characterize areas as an indicator of multiple factors such as presence of population, infrastructure (e.g. factories, energy plants), as well as energy consumption, light pollution, and more.
Global night-time lights; open in full screen here.
Another new variable is cell tower count, which is based on the data provided by OpenCellid, and details the number of cell towers of 3G, 4G and 5G technologies present in each grid cell. This indicator can be used not only to analyze access to telecommunication infrastructure and services, but also as a proxy for human presence, urbanity, and wealth.
This new version of Spatial Features is already available as a premium dataset in CARTO’s Data Observatory. You can also access free samples from there. Additionally in order to encourage innovation and gain valuable feedback on this new product we are offering CARTO Spatial Features for the United States, United Kingdom and Spain in the Quadbin level 15 and H3 Resolution 8 formats as public datasets which can be accessed free of charge with a CARTO Enterprise account.


.png)
